
TL;DR: The interbank rate is the clearest daily signal of what the State Bank of Vietnam (SBV) is really doing. Policy rates (refinancing 4.5%, rediscount 3.0%, overnight electronic lending 5.0%, OMO 4.5%) change rarely and state intent. The interbank rate and daily open market operation (OMO) results move every day and show what liquidity is actually doing.
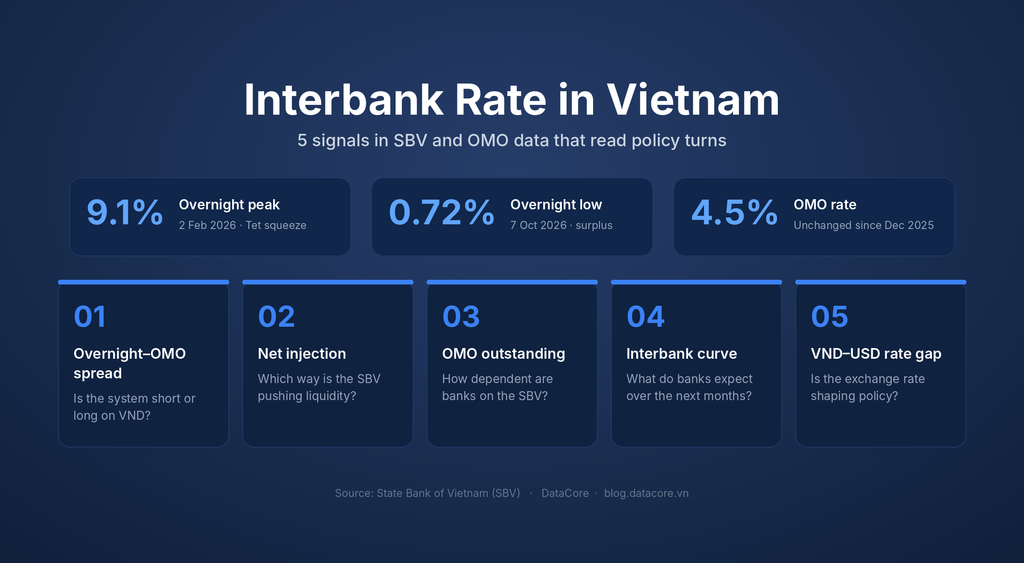
Read together, the gap between the overnight interbank rate and the 4.5% OMO rate, the direction of net injection, the OMO outstanding balance and the shape of the interbank rate curve give five signals. In 2026 they flagged the February Tet squeeze (overnight 9.1%), the late-September stress (7%), the October flood of liquidity (0.72%) and the turn toward lower lending rates after the SBV Governor met bank leaders on 19 October 2026.
Most people watch the SBV for one thing: a cut or hike in policy rates. But the refinancing and rediscount rates have not moved since June 2023 while the OMO rate has only moved once, in December 2025. Over the same period the overnight rate has swung from below 1% to above 9%. If you only watch headline rates, you miss almost everything the central bank does.
Daily interbank rate data is where policy lives. Every working day the SBV runs OMO auctions, publishes how much it lent and how much matured, and reports average rates by tenor. That stream is free, public and fast. It is also noisy and easy to misread.
What Is the Interbank Rate, and What Are SBV's Policy Rates?
The interbank rate is the price banks charge each other for short-term VND loans. Policy rates are the prices at which the SBV itself lends to banks. The first is set by the market every day. The second is set by decision of the Governor and changes rarely.
The interbank rate: the market's price of liquidity
When a bank ends the day short of VND to settle payments or meet reserve requirements, it borrows from a bank with surplus cash. The SBV publishes the volume-weighted average rate for each tenor: overnight, 1 week, 2 weeks, 1 month and longer.
The overnight tenor dominates. According to SBV data, in the week of 14 to 18 September 2026 VND interbank turnover was close to 4.8 quadrillion dong, and overnight trades made up about 96% of it. That is why analysts treat the overnight rate as the interbank rate.
The four SBV rates that frame the interbank rate
| Rate | Current level | What it is | Last changed |
|---|---|---|---|
| Refinancing rate | 4.5% / year | SBV lending to banks against credit files, the formal ceiling reference | 19 June 2023 |
| Rediscount rate | 3.0% / year | SBV discounting of valuable papers, the formal floor reference | 19 June 2023 |
| Overnight electronic interbank lending (and clearing shortfall) rate | 5.0% / year | Last-resort overnight loan to cover payment gaps | 19 June 2023 |
| OMO rate (reverse repo on the pledge channel) | 4.5% / year | SBV lends against government bonds and other valuable papers, 7 to 91 days | Raised from 4.0% in early December 2025 |
Source: SBV, Decision 1123/QD-NHNN (June 2023) and SBV OMO auction results. The SBV kept its operating rates unchanged through the first half of 2026.
OMO: the tool that moves the interbank rate
Open market operations are how the SBV adds or drains VND day to day. It runs two channels:
- Pledge (reverse repo) channel: the SBV buys valuable papers from banks with a promise to sell them back, lending VND for 7 to 91 days. New lending injects cash; maturities drain it.
- Treasury bill channel: the SBV sells its own bills to soak up surplus VND. Issuance drains cash; maturing bills return it.
Net injection on a given day = new pledge lending + maturing bills − maturing pledge loans − new bill issuance. The running total of pledge loans still outstanding is the OMO outstanding balance - a stock measure of how much the system leans on the central bank.
How Does the SBV Rate Corridor Hold the Interbank Rate?
In principle the SBV's rates form a corridor that holds the overnight interbank rate between a floor and a ceiling. Vietnamese analysts usually read the rediscount rate (3.0%) as the floor, the overnight electronic lending rate (5.0%) as the hard ceiling, and the OMO rate (4.5%) as the level where the SBV actually supplies cash day to day.
The logic is arbitrage. A bank short of cash should never pay much more than it would pay the SBV, and a bank with surplus has little reason to lend far below what the SBV's own instruments offer.
In practice the corridor is soft. SBV lending needs eligible collateral, mostly government bonds, and when banks run short of it they pay up in the market instead, pushing market rates above the ceiling. That shortage of collateral is one reason the SBV added USD/VND swaps in late 2025. The chart shows how often 2026 broke the corridor.
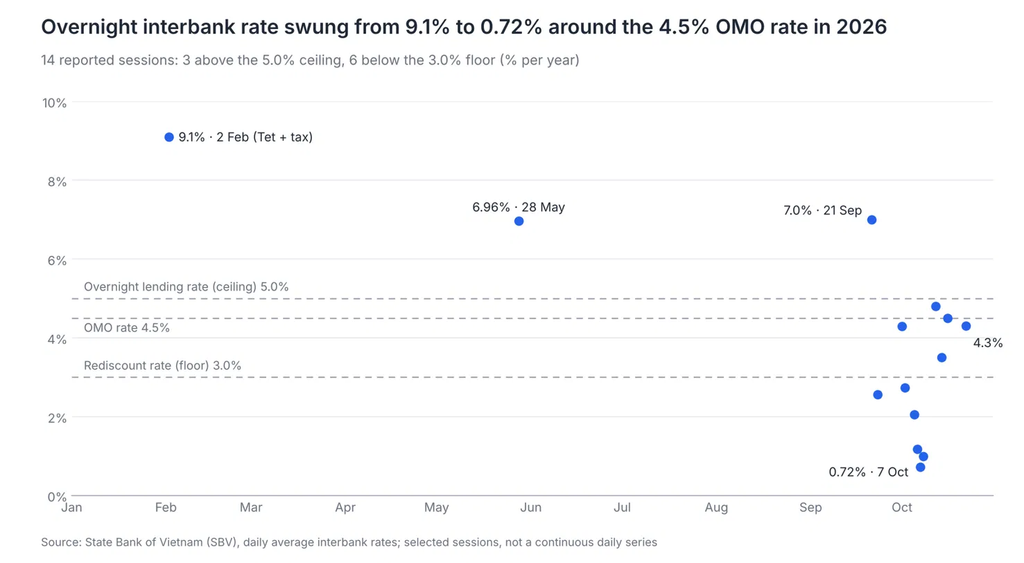
Overnight broke above the ceiling around Tet, in late May and in late September, then fell far below the floor in early October as liquidity from swaps and OMO piled up. By late October it was back near the OMO rate. The corridor marks where the SBV wants rates; the data shows how hard it has to work to keep it there.
What Are the 5 Signals in Interbank Rate and OMO Data?
Five measures, all built from data the SBV publishes daily, carry most of the information. Each answers a different question, and they are strongest when they agree.
1. The interbank rate–OMO spread: is the system short or long on VND?
Subtract the OMO rate (4.5%) from the overnight interbank rate. A positive spread means banks pay more to borrow from each other than the SBV charges, so cash is scarce. A deep negative spread means banks are flush and cannot lend their surplus.
Rule of thumb: an overnight rate above 5% (the overnight lending ceiling) for several sessions signals stress the SBV has not yet absorbed. Below 2% signals excess liquidity. On 22 October 2026 the overnight rate was 4.3%, a spread of −0.2 points: balanced.
2. Net injection: which way is the SBV pushing?
Net injection is the flow. Sustained net injection means the SBV is supplying cash, usually to cap market rates. Sustained net draining means it is pulling back, either because liquidity is ample or because it wants rates higher to defend the dong.
The key is the pairing with signal 1. Injection while the interbank rate rises = demand is outrunning supply. Draining while it falls = the SBV judges the system over-supplied. In the first three sessions of October 2026 the SBV drained a net 39,129 billion dong while the overnight rate fell to 0.72%.
3. OMO outstanding and tenor mix: how dependent are banks on the SBV?
The outstanding balance is the stock. A rising balance means banks rely more on central bank funding; a falling one means they are standing on their own. The tenors the SBV offers add intent: longer tenors keep cash in the system for longer.
In November 2025 the SBV offered a 105-day tenor for the first time, beyond its usual 7 to 91 days, a signal of sustained support into year-end. By 19 October 2026 the balance had fallen to about 103,656 billion dong, down from roughly 376,000 billion in February.
4. The interbank rate curve: what do banks expect next?
Compare the overnight rate with 1-month, 3-month and 6-month tenors. Short tenors react to today's cash position. Longer tenors price what banks expect over the coming months, including deposit competition and credit demand.
A curve that stays steep even when overnight falls tells you the relief is seen as temporary. In late May 2026 overnight was 6.96% but the 6-month tenor reached 8.34%, and deposit rates kept climbing over the following months.
5. The VND–USD interbank rate gap: is the exchange rate in play?
The SBV also publishes USD interbank data. When VND rates fall far below USD rates, holding dollars pays more than holding dong, which pressures the exchange rate. When VND rates sit well above USD rates, the dong is supported.
This signal explains choices the first four cannot. In December 2025 the SBV raised the OMO rate to 4.5% while launching USD/VND swaps: the swaps added VND, and the higher OMO rate set a floor so VND rates would not collapse toward USD levels (about 3.9%). On 22 October 2026 USD overnight was 3.85% against 4.3% for VND.
How Did Interbank Rate Signals Play Out in 2026?
Across 2026 the signals told one story: heavy dependence on the SBV early in the year, then a steady weaning that ended in a liquidity surplus in October. The outstanding OMO balance traces the arc.
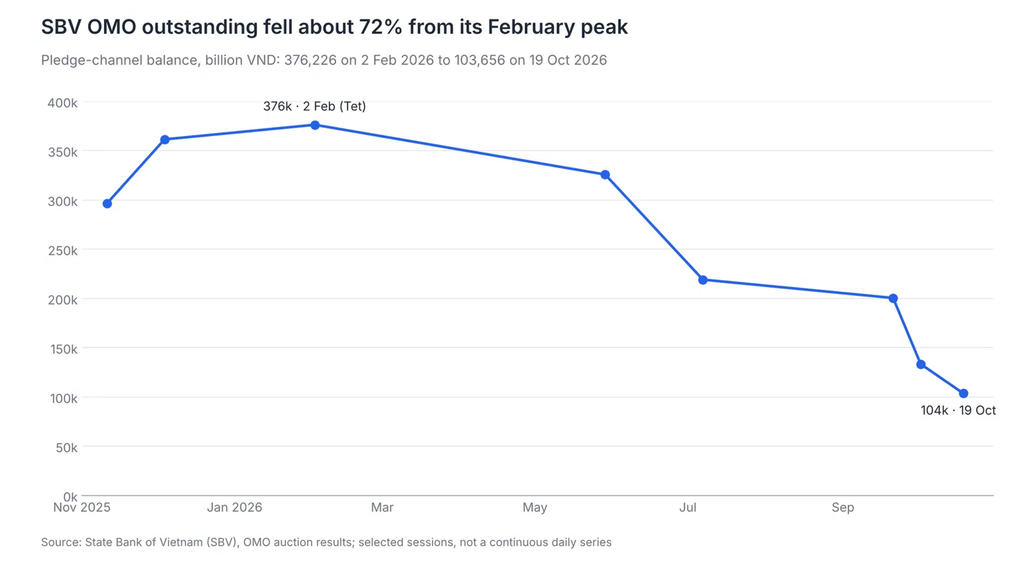
The balance peaked during the Tet squeeze and fell through the year as the SBV let loans mature, with only brief re-injections when rates spiked. The events below show what each signal said at the turning points.
| Date | What happened | What the signals said |
|---|---|---|
| 19 Oct 2026 | Governor meets bank leaders; banks agree to cut deposit and lending rates; VietinBank cuts lending rates by 2 points | Easing by guidance, not by policy rate; possible because the interbank rate sat near OMO and the balance was low |
| 7 Oct 2026 | Overnight rate falls to 0.72%; SBV drains 39,129 billion in three sessions | Deep surplus: spread −3.8 points, draining while rates fell |
| 28 Sep–2 Oct 2026 | Net drain of 53,475 billion; balance down to 133,342 billion | Dependence falling fast; the SBV judged September's swap and OMO support more than enough |
| 21–23 Sep 2026 | Overnight rate hits 7%; SBV injects about 47,915 billion in one session and offers FX swaps; overnight back to 2.56% two days later | Acute stress met with two tools at once; the speed of the fall showed the SBV's resolve |
| 7 Jul 2026 | SBV drains 15,964 billion; balance about 219,055 billion | Dependence easing after the mid-year squeeze |
| 25–29 May 2026 | Net injection of 30,733 billion after two weeks of draining; overnight 6.96%, 6-month 8.34% | Steep curve: banks expected tight funding to last; deposit rates rose in the months after |
| 2 Feb 2026 | Overnight rate jumps to 9.1%; SBV injects 55,363 billion; balance 376,226 billion | Classic Tet and tax squeeze; flat 2-week rate (6.4%) marked it as temporary |
| Early Dec 2025 | OMO rate raised from 4.0% to 4.5%; USD/VND swaps launched | VND–USD gap in play: more VND supplied, but a higher floor to protect the dong |
Source: SBV daily interbank and OMO auction announcements.
How Do Policy Rates, the Interbank Rate and OMO Data Compare?
The three data sets answer different questions, so none replaces the others. The table compares them as data sources; it summarises how each behaves, not measured results.
| Dimension | Policy rates | Interbank rates | OMO auction results |
|---|---|---|---|
| Who sets it | SBV Governor, by decision | Market, trade by trade | SBV offers, banks bid |
| Update frequency | Rare (none since June 2023 for refinancing and rediscount) | Daily, by tenor | Daily, by tenor and volume |
| What it tells you | Stated stance and the corridor's edges | Actual cost and scarcity of VND today | How much cash the SBV is adding or removing, and for how long |
| Lead time | Lags: confirms a turn already under way | Leads by days to weeks | Leads; shows the SBV's reaction function |
| Noise | Very low | High around Tet, tax deadlines and quarter-ends | Medium; single sessions can mislead |
| Best use | Anchor and reference levels | Stress detection, curve expectations | Intent, dependence, policy reaction |
Takeaway: policy rates tell you where the SBV says it stands; the interbank rate and OMO data tell you what it is doing. When the daily data drifts from the stated stance for weeks, the stated stance is usually what changes next.
Who Can Use Interbank Rate Signals, and for What?
The same five signals answer different questions depending on who is reading them.
- Bank treasury and ALM teams: the interbank rate spread and curve set day-to-day funding decisions: borrow overnight or lock in 1 month, bid at OMO or go to the market. A rising outstanding balance is an early warning that the whole system, not just one bank, is short.
- Equity investors: liquidity drives Vietnam's market, and bank, securities and real estate stocks are most rate-sensitive. A turn from net draining to sustained injection, with overnight falling below OMO, has often preceded easier conditions for these sectors. Persistent stress above 5% tends to weigh on them.
- Bond investors: short-term government bond yields track interbank conditions. At the mid-October 2026 auction, 3-, 5- and 10-year government bonds cleared at 3.55%, 4.27% and 4.43%, below the 1-month interbank tenor at the time. That gap is itself a signal of where banks park cash.
- Corporate finance teams: deposit and lending rates follow the interbank rate curve with a lag. When 3- to 6-month tenors rise for weeks, expect banks to reprice loans upward; when the SBV leans on banks to cut, as at the Governor's meeting of 19 October 2026, it is a window to negotiate.
- Economists and policy researchers: the five signals together reveal the SBV's reaction function, how it trades off growth, credit and the exchange rate, far better than the static policy rates. They also feed nowcasts of credit growth and inflation pressure.
- Data and analytics teams: interbank rate data arrives as daily SBV announcements in Vietnamese. Turning it into clean, comparable time series with consistent tenors and units is the work that makes every use above possible.
What Are the Pitfalls When Reading Interbank Rate Data?
Most misreadings come from treating one session, one tenor or one channel as the whole story.
- Calendar noise. Tet, quarterly tax payments, quarter-ends and long holidays reliably spike overnight rates. Compare against the same point in previous years before calling a trend.
- One day is not a trend. Overnight can move 3 points in a session and reverse the next. Use 5-day averages for signal 1 and weekly sums for signal 2.
- Net draining is not always tightening. The SBV often drains simply because loans mature while liquidity is ample. Read it against the spread, never alone.
- OMO is not the only tool. FX swaps, treasury bills, direct FX sales and guidance to banks also move liquidity. In September 2026 the SBV offered FX swaps of up to 2 billion USD alongside OMO; watching only OMO would have understated the injection.
- Averages hide dispersion. The published interbank rate is a system average. Small banks may pay far more than large state-owned banks on the same day.
- Secondary reports differ. News summaries round figures and sometimes mix daily and weekly numbers. Always store the series from the SBV's own announcements.
Is the SBV's Real Policy in the Headline Rates or the Interbank Rate?
Mostly the interbank rate. Vietnam's formal policy rates have been still for more than three years, while the overnight rate ranged from 0.72% to 9.1% in 2026 alone. The real policy is the daily decision on how much VND to add or remove, at what price and for how long.
That decision leaves a public trace every working day. The interbank rate–OMO spread shows scarcity, net injection shows the SBV's push, the outstanding balance shows dependence, the curve shows expectations and the VND–USD gap shows whether the exchange rate is shaping the response.
Watched together, they turn a stream of SBV announcements into an early read on liquidity, rates, credit and markets. The next post in this series follows the interbank rate one step further down the chain: how it passes through to deposit and lending rates at Vietnamese banks.
Frequently Asked Questions About the Interbank Rate in Vietnam
What is the interbank rate in Vietnam?
The interbank rate is the average rate at which Vietnamese banks lend VND to each other, published by the SBV by tenor. The overnight tenor carries over 90% of turnover, so it is the headline figure.
What is the OMO rate, and what is it now?
It is the rate at which the SBV lends to banks against government bonds and other valuable papers on its pledge channel. It has been 4.5% a year since early December 2025, up from 4.0%.
Why does the interbank rate move so much when policy rates do not?
Policy rates are set by decision and changed rarely. The interbank rate reflects daily supply and demand for VND, which swings with tax payments, Tet, credit growth, deposit flows and SBV operations.
Does net draining by the SBV mean monetary tightening?
Not necessarily. Draining often happens because loans mature while liquidity is already ample. It signals tightening only when rates are rising at the same time, or when the SBV issues treasury bills to absorb cash.
How does the interbank rate help predict lending rates?
Sustained moves in 1- to 6-month interbank tenors tend to pass into deposit rates and then lending rates over weeks to months. Part 2 of this series examines that pass-through.
References
- State Bank of Vietnam, daily average interbank interest rates and transaction volumes (VND and USD), 2025–2026. sbv.gov.vn
- State Bank of Vietnam, open market operation auction results (pledge channel and treasury bills), 2025–2026. sbv.gov.vn
- State Bank of Vietnam, Decision 1123/QD-NHNN on refinancing, rediscount and overnight electronic interbank lending rates, effective 19 June 2023. sbv.gov.vn
- State Bank of Vietnam, "Bank credit continues to support economic growth", 2026. sbv.gov.vn
- State Bank of Vietnam, press conference on Q1 2026 monetary policy results, 14 April 2026. sbv.gov.vn
How Vietnam’s 2025 Commune Merger Quietly Broke Bank Customer-Address Tables (And the Cleanup Pattern That Works)How Vietnam’s 2025 Commune Merger Quietly Broke Bank Customer-Address Tables (And the Cleanup Pattern That Works)How Vietnamese Fintechs Are Re-Wiring KYB Onboarding Around a Single Resolver Call






Để lại một bình luận
You must be logged in to post a comment.