In an era where data has become a valuable asset, stock market investing is gradually shifting from intuition-driven to quantitative approaches. As a result, the demand for tools capable of processing, analyzing, and extracting insights from data is becoming increasingly critical.
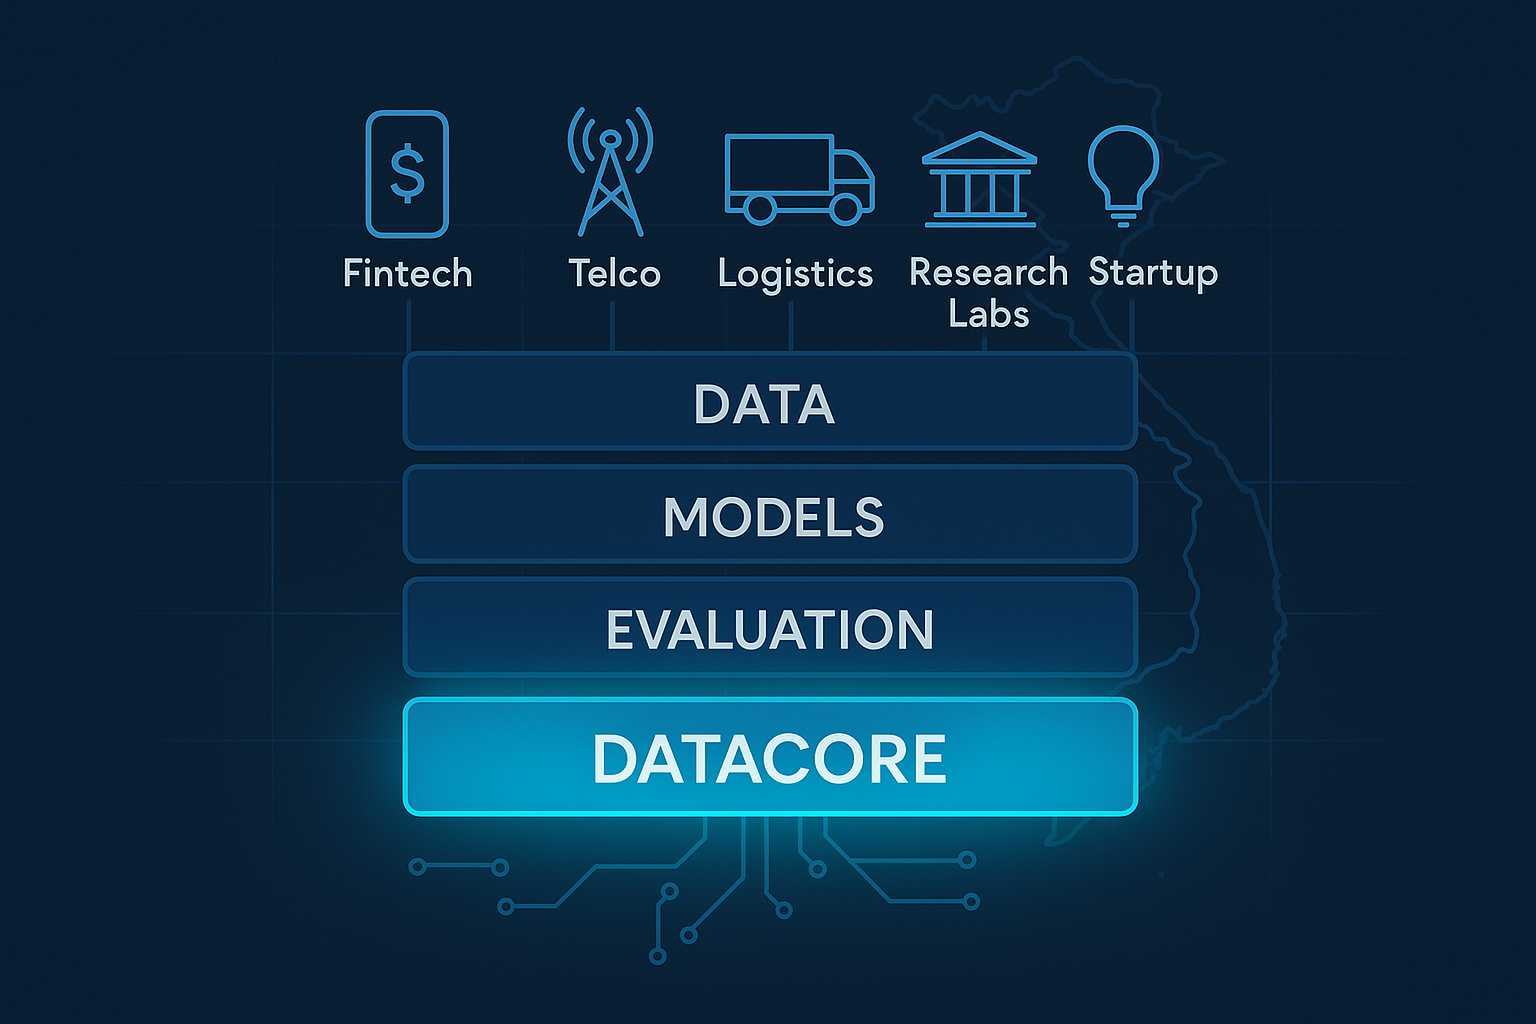
Grasping the trend of data-driven investing, DataCore is progressively deploying technological solutions to support individual investors in making decisions based on empirical data rather than intuition. With this orientation, DataCore aims to provide investors with intelligent analytical tools that help them approach the market in a more scientific, transparent, and efficient manner.
1. Problem Statement: When Intuition Is No Longer Sufficient in Investing
Stock market investing is not merely about selecting stocks that are “going up,” but rather a problem of risk management and portfolio optimization. In a market where prices fluctuate by the minute and investor sentiment can change within hours, relying on intuition is gradually becoming unsafe.
In contrast, historical stock price data provides investors with an objective and in-depth source of information. By analyzing cycles, trends, and volatility ranges, data enables investors to identify market behavior, thereby helping them build more rational strategies.
These seemingly dry numbers actually reflect the market’s “psychology” over time. By exploiting returns, volatility, and correlations among stocks, investors can visualize the underlying risk structure-forming the foundation for selecting a more optimal portfolio.
This is also the core focus of the initial phase of the system currently being developed by the D&A team at DataCore: analyzing historical data for each stock ticker to support the formation of investment portfolios in a scientific and transparent manner.
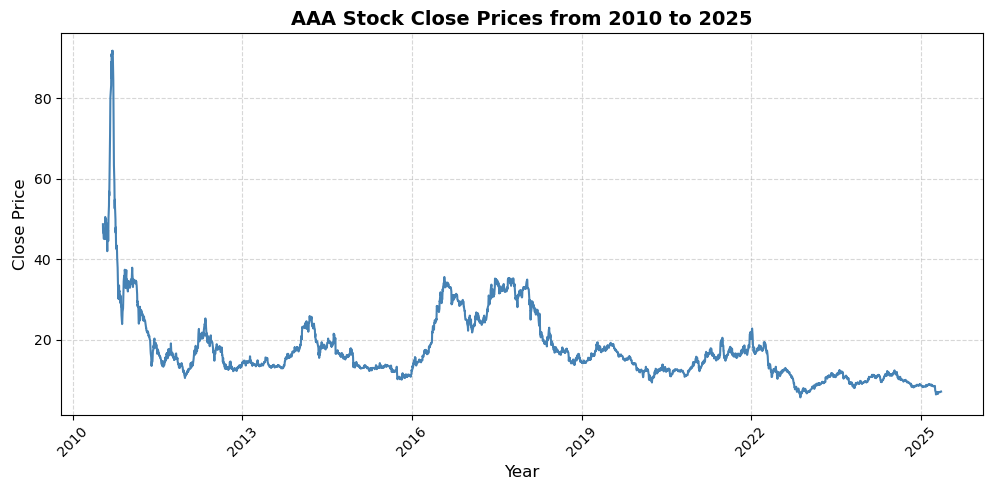
The chart clearly illustrates cycles of growth, correction, and accumulation-showing that data is not merely a series of numbers, but also the “behavioral traces” of the market.
2. Individual Stock Analysis: The Foundation of Portfolio Construction
When analyzing stock data, observing the return distribution is the first step toward understanding how a stock fluctuates over time. The two charts below present the distribution of daily returns and monthly returns, constructed from historical data of stocks in the portfolio.
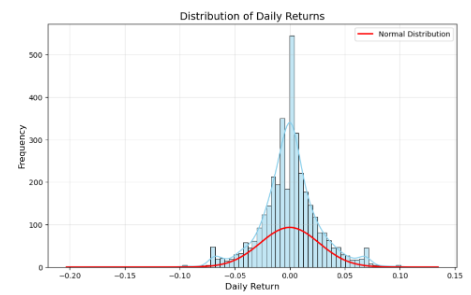
In the daily return chart, the horizontal axis represents the percentage change in price per day, while the vertical axis shows frequency. Most bars are concentrated around 0%, indicating that stock prices typically fluctuate slightly around the mean-reflecting a stable market state for most of the time. The red curve represents the theoretical normal distribution, used for comparison with actual data to help identify deviations between real market behavior and the idealized model.
The monthly return distribution therefore helps investors assess the medium-term stability of a stock-whether it frequently experiences large fluctuations or maintains a steady growth rhythm over time.
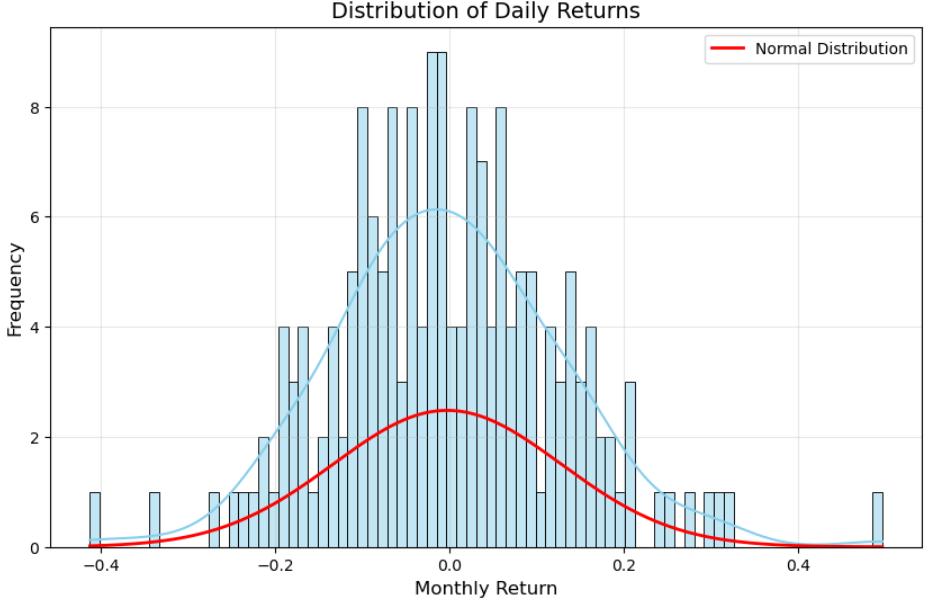
Meanwhile, the monthly return chart aggregates data over a longer time frame, resulting in greater overall volatility and a more “spread out” distribution. This is entirely normal, as over longer periods, stock prices have more opportunities to rise or fall significantly compared to individual days.
These two charts demonstrate how data enables investors to gain deeper insights into stock price behavior. Rather than merely observing price increases and decreases, analyzing return distributions allows investors to understand the “temperament” of each stock: which stocks are stable, which are sensitive, and which are more prone to strong market impacts. This forms the basis for quantitative assessments in the next step.
3. From Analysis to Portfolio Formation: The Initial Step of Quantitative Investing
After understanding the nature of individual stocks, the next step is to use these quantitative indicators to form an initial investment portfolio.
At this stage, the goal is not to evaluate portfolio performance, but to create a set of stocks that balances expected returns with acceptable risk.
The D&A team simulates multiple portfolio combinations, allowing users to compare trends and volatility of each stock within the same time frame. Investors can easily observe differences in stability and returns, as well as select the analysis period that aligns with their objectives.
Investors can choose their desired time frame to observe stock performance and reactions.
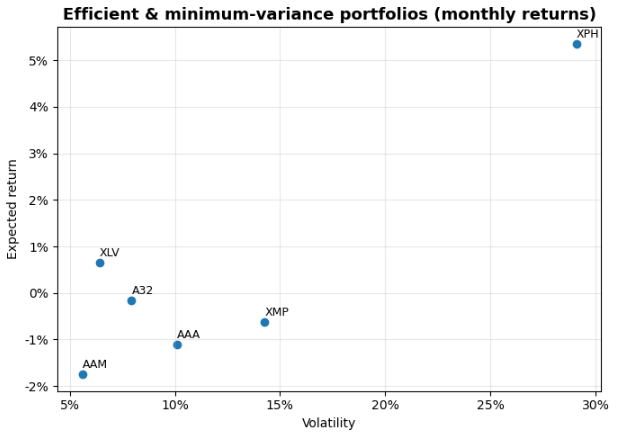
Finally, the system displays the relationship between risk and average return for each stock on a μ-σ chart. Each point on the chart represents a stock, with the vertical axis showing average return and the horizontal axis indicating volatility. Through this, investors can easily identify which stocks are “safe” and which are “risky,” thereby selecting suitable groups of stocks to build their portfolios.
At present, this represents only the first stage in DataCore’s project development process-focusing on data analysis and portfolio formation based on basic quantitative indicators. The system has not yet progressed to evaluating portfolio performance or optimizing overall risk-return trade-offs.
This stage serves as the foundation for data infrastructure and visualization tools, helping investors clearly understand the nature of each stock before moving on to portfolio evaluation and optimization in later stages.
4. Conclusion
Data analysis not only opens up a new perspective on the stock market, but also lays the groundwork for modern investment thinking-where every decision is based on evidence and quantitative models. With the initial phase of its analytical system, DataCore does not aim to provide specific investment recommendations, but instead focuses on building a reliable, transparent, and intuitive set of tools to help investors approach the market with greater confidence.
By deeply leveraging historical data, simulating stock behavior, and visualizing risk-return dynamics, DataCore aims to help individual investors reduce reliance on intuition while adopting a more scientific approach to portfolio management. This represents an important first step toward more advanced stages of quantitative investing-including performance evaluation, portfolio optimization, and trading strategy modeling.
In a context where data has become a core asset of the digital economy, DataCore is committed to continuously improving its system, expanding models, and enhancing analytical capabilities to help investors maximize the value of data-moving toward a smarter, more transparent, and more sustainable investment approach.


Để lại một bình luận
You must be logged in to post a comment.