
Satellite data has become an important source of information for economic analysis, especially in places where official statistics are sparse or slow to arrive. From night-time lights to high-resolution images of the ground, observations from space let analysts see economic activity in every location, including places no survey has ever reached. This article introduces the most common types of satellite data, how they are used in practice, and the limits every user should understand before making decisions based on them.
What is satellite data?
Satellite data is information about the Earth's surface collected by observation satellites. Four types are used most often in economic analysis:
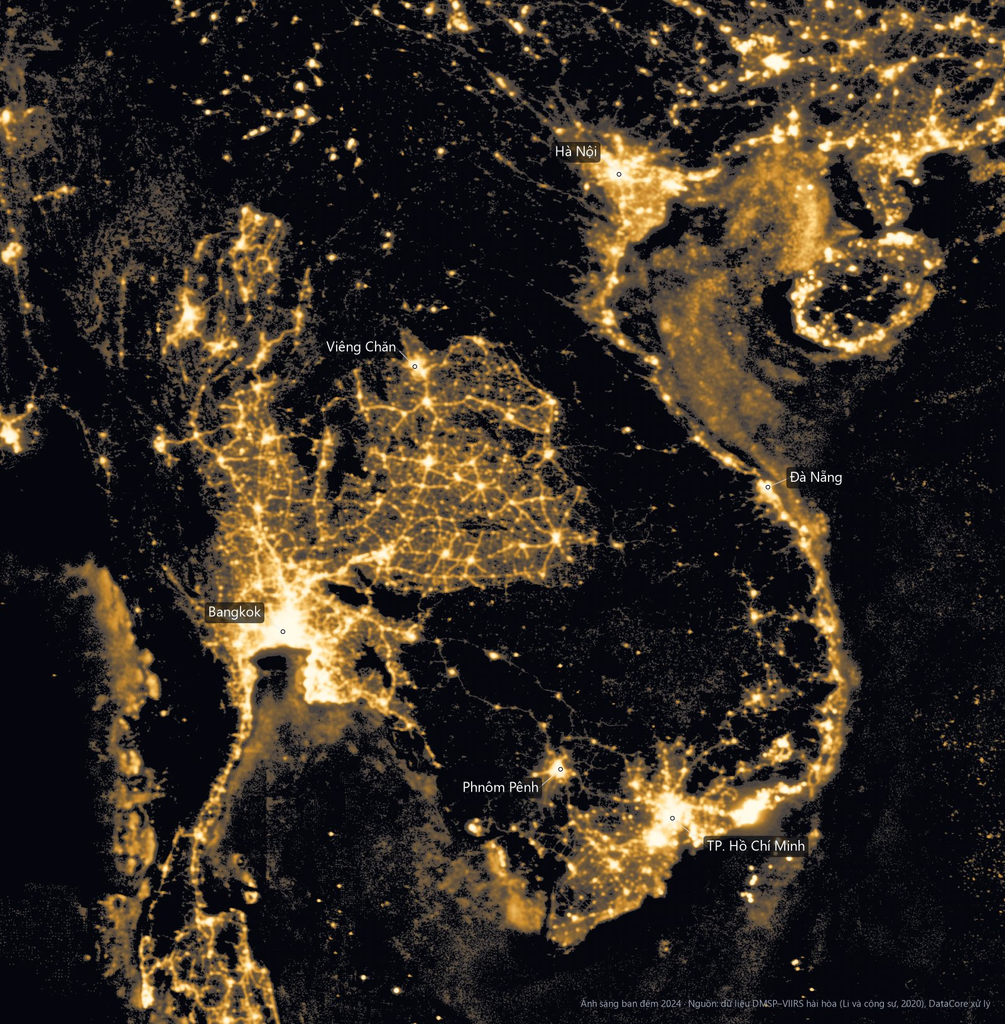
- Night-time lights. The intensity of light emitted from the ground at night. Places with street lighting, factories and dense housing appear brighter. The two main sources are the DMSP satellites, with records from the early 1990s, and the VIIRS sensor, available since 2012 with finer detail and higher sensitivity.
- Daytime optical imagery. Pictures of the ground that show buildings, roads, fields and roofs. Free sources such as the European Space Agency's Sentinel-2 (10 m resolution) and the US Landsat program (30 m) are updated every few days.
- Gridded population data. Estimates of how many people live in each small grid square, built by combining satellite imagery with census counts.
- AI-generated embeddings. Machine learning models summarise satellite images into a list of numbers that describes each location, ready to feed into prediction models.
Why satellite data is useful for economic analysis
Household surveys remain the most reliable way to measure income and living standards, but they are expensive, run infrequently, and usually have enough respondents to represent only provinces or regions. Many important decisions, however, are made for districts, municipalities or even individual neighbourhoods.
Satellite data fills part of this gap thanks to three features:
- Full coverage: every location is observed in the same way, including remote areas.
- Regular updates: from every few days to once a year, depending on the source.
- Consistency: the same measurement method applies to every region and every country, which makes comparisons straightforward.
The influential study by Henderson, Storeygard and Weil (2012) showed that night-time lights track national economic growth closely, opening the way for satellite data in economics.
How satellite data is used in practice
Poverty mapping and policy targeting
A team led by Jean et al. (2016) combined daytime imagery and night lights to estimate living standards in African villages. Later, Chi et al. (2022) built a Relative Wealth Index for 135 low- and middle-income countries. Maps like these help governments direct resources to the areas that need them most.
Banking and credit
Banks and lenders use satellite data to assess the potential of each area: population density, the pace of urbanisation, and the amount of new construction. This information supports decisions on where to open branches, place ATMs, or allocate credit limits by region.
Retail and site selection
Retail chains can estimate the size and purchasing power of the population within a given radius of a proposed store, instead of relying on averages for an entire province.
Public investment and disaster monitoring
Satellite images make it possible to track infrastructure projects, assess damage after storms and floods, and follow the recovery of economic activity without waiting for local reports.
The limits of satellite data
Better at "where" than "when"
Satellite data ranks places well, showing which are richer and which are poorer, but it is much weaker at measuring change over time. Studying many African countries, Yeh et al. (2020) found that models predicted levels of well-being far better than changes in well-being.
Saturated lights in big cities
In the centres of large cities, night-time lights often reach the maximum value a sensor can record. At that point, wealthy and modest neighbourhoods look the same from above.
Rural and farming areas
Night-time lights mainly reflect non-farm activity. In farming areas, household income comes from fields, which do not light up at night.
A model trained in one place may fail in another
A model trained in one country or region usually loses much of its accuracy when applied somewhere with different conditions. Adding a small amount of real data from the new region is often far more effective than adjusting the model alone.
Combining satellite data with official statistics
The approach adopted by many statistical offices and by the World Bank is to combine the two sources rather than choose one. Official surveys set the income level for the areas they represent well, such as provinces. Satellite data is used only to distribute that figure to smaller units within each area. This method, known as small area estimation, keeps the reliability of the survey while adding detail down to the local level.
Five questions to ask before using an indicator built from satellite data
- Which real-world data was the indicator validated against, and was it tested in places outside the area the model was trained on?
- What is the error or confidence interval of each figure?
- Is the indicator anchored to official statistics?
- Do you need to know "where" or "when"? For questions about short-term change, official statistics are still more reliable.
- Is your area of interest one of the hard cases, such as a large city centre or a mainly agricultural region?
Conclusion
Satellite data cannot replace official statistics, but it is a powerful complement when used correctly: to answer the question "where", with clearly stated errors, and anchored to survey figures. DataCore applies this approach in its GeoEcon module to provide economic estimates down to the commune level for Vietnam. Contact DataCore to learn more.