If you happened to compare two population charts side by side, you might notice something striking:
in 2024, Vietnam appears with its familiar 63 provinces and centrally governed cities, but in 2025, a similar chart shows only 34 administrative units.
This is neither a data error nor missing information. It is the direct outcome of a large-scale administrative restructuring implemented nationwide.
In this blog post, I aim to unpack the story behind that visualization:
why the mergers occurred, what policy motivations drove them, and what insights we can extract from the resulting data. This is not merely a story about numbers-it is a narrative about governance, demographic change, and national development strategy.
To illustrate this transformation, we use a specialized visualization technique: the Radial Tree Map-a circular, hierarchical diagram particularly well suited for administrative data.
Why Use a Radial Tree Map for Administrative Data?
Several visualization types can represent hierarchical structures-such as traditional tree diagrams, organizational charts, or geographic maps. However, the radial tree offers distinct advantages for this specific case.
A Unified View of the Entire System
All provinces and cities-before and after restructuring-are displayed within a single circular framework. This immediately conveys that:
The consolidation was a coordinated, nationwide reform, not a series of isolated provincial changes.
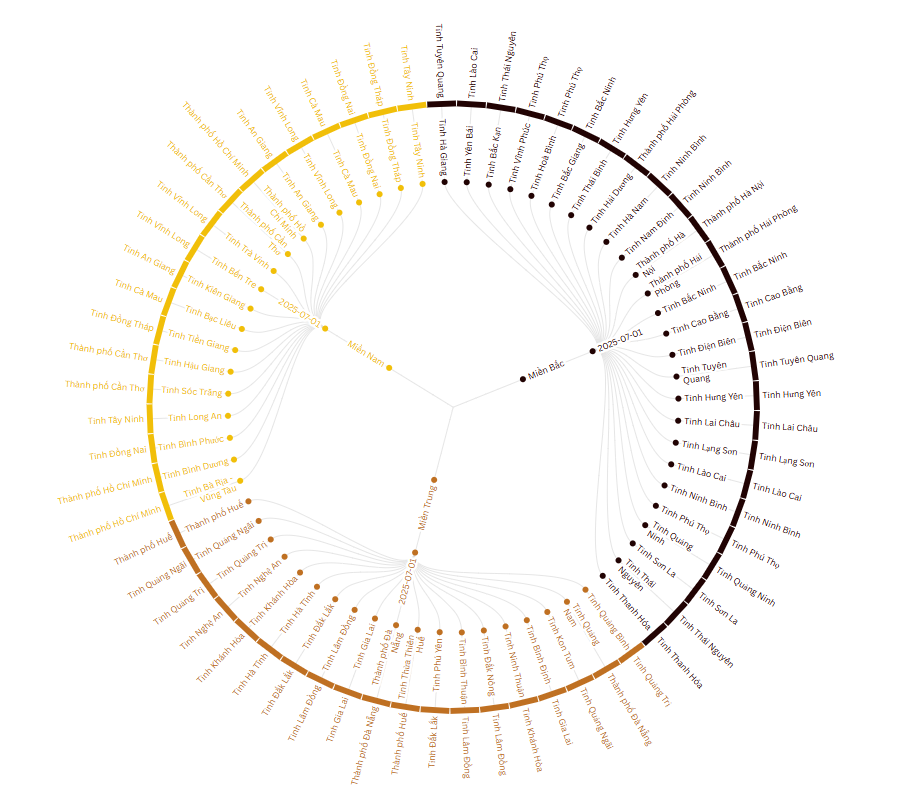
Biểu đồ thể hiện sự thay đổi tỉnh/thành Việt Nam trong năm 2025
Regional Identification Through Color Encoding
The chart uses three distinct color palettes corresponding to Vietnam’s major regions:
- Northern Vietnam → dark brown
- Central Vietnam → orange
- Southern Vietnam → yellow
With a single glance, viewers can identify which region experienced the most significant administrative changes.
Clear Hierarchical Structure
The visualization is organized into three levels:
- Inner nodes → Region (North, Central, South)
- Middle nodes → Implementation milestone (here, 01 July 2025, the effective date of mergers and renamings)
- Outer ring → Provinces and cities after restructuring
Conceptually, this structure resembles:
“Standing at the center and observing the entire country unfold in three directions.”
How to Read the Chart: Three Simple Steps
Step 1: Identify the Region by Color
- Yellow → South
- Orange → Central
- Brown → North
This is the fastest way to locate the province or city of interest.
Step 2: Follow the Connecting Paths Inward
Each link reveals:
- Which regional group the new province belongs to
- How many former provinces or cities were merged to form it
Step 3: Locate Converging Nodes
When multiple branches converge into a single outer node, it indicates a new administrative unit formed through consolidation.
Visual Examples and Key Observations
1. Regional Distribution
- Northern Vietnam displays the highest density of nodes, reflecting its historically larger number of provinces.
- Central Vietnam appears more compact, occupying a smaller arc of the circle-highlighting its comparatively lower administrative density.
- Southern Vietnam, marked in yellow, spans a wide arc, illustrating its broad geographic footprint and dynamic urban structure.
2. Administrative Changes: Mergers and Boundary Adjustments
A notable example is the new Can Tho City, established through the merger of:
- Hau Giang Province
- Soc Trang Province
- The former Can Tho City
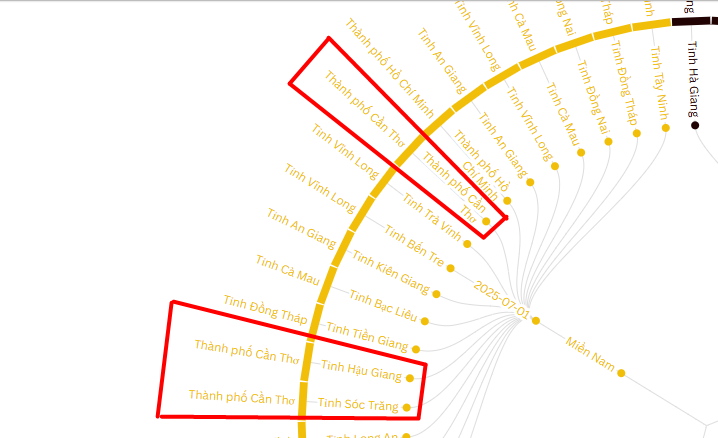
Sự thay đổi tên/sát nhập của thành phố Cần Thơ (ảnh minh họa)
Interactive Features of the Radial Tree Map
A key strength of the Radial Tree Map lies in its multi-level interactivity.
- Clicking on a province triggers a tooltip displaying essential information:
province name, effective date, region, and number of child nodes. - Clicking again expands the hierarchy, revealing:
- Original provinces
- Historical splits and mergers
- Associated timeline milestones
This “layer-peeling” interaction allows users to explore complex administrative histories progressively, avoiding information overload while preserving logical continuity.
Key Insights from the Visualization
The post-merger administrative structure of Vietnam after 01 July 2025 highlights clear regional contrasts:
- Southern Vietnam, characterized by rapid urbanization, experienced the most significant consolidation-reflecting efforts to streamline local governance and improve administrative efficiency.
- Central Vietnam underwent more balanced adjustments, focusing on boundary rationalization and scale optimization.
- Northern Vietnam saw fewer mergers, preserving many traditional provinces and demonstrating a comparatively stable administrative structure.
These differences illustrate not only a region-specific policy approach, but also the distinct development priorities shaping Vietnam’s administrative reform.
Conclusion
The administrative restructuring effective 01 July 2025 represents a major milestone in Vietnam’s effort to streamline governance and enhance local administrative efficiency.
While the scale and nature of change vary across regions, the common objective remains clear: building a more responsive, efficient, and development-oriented administrative system. These reforms lay a critical foundation for future socio-economic policies and reflect a strategic alignment between governance structures and regional development dynamics.


Để lại một bình luận
You must be logged in to post a comment.